
What your ROAS doesn't tell you when you scale spend
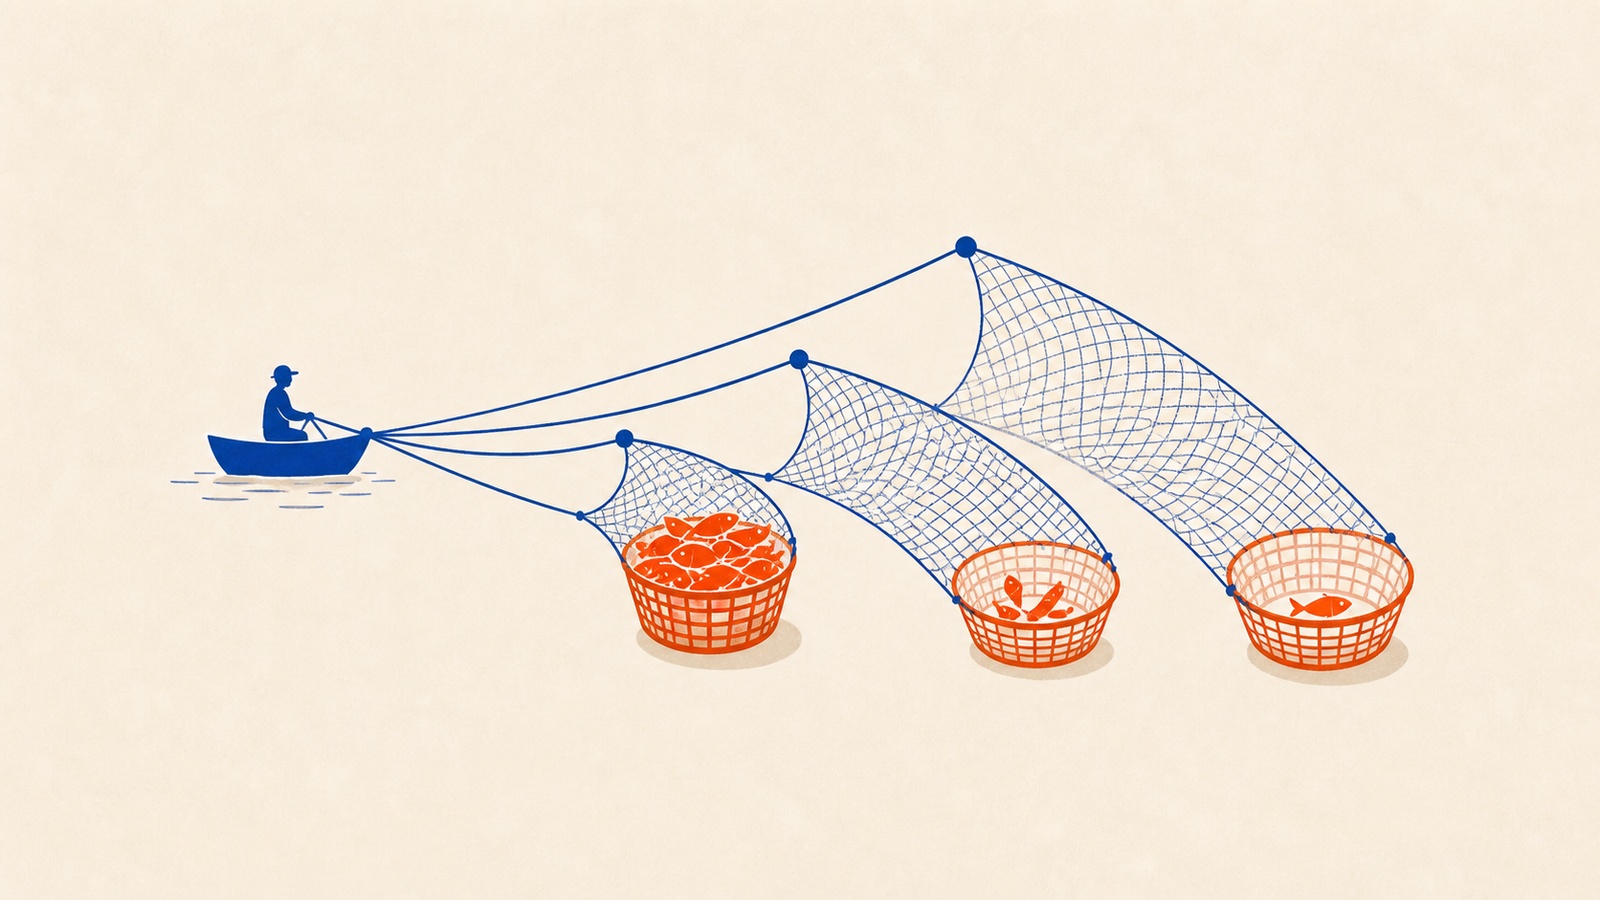
A campaign that returns $6 for every dollar spent looks like a reason to spend more. Increase the budget five times over, and that same campaign might return half as much per dollar, not because anything broke, but because the easiest customers were already found at the smaller budget.
This is the part most marketing dashboards hide by default. They're built to show a single ROAS number trending over time, which makes a widening budget look like a straightforward win: more revenue, more customers, line going up. Nobody built a dashboard that defaults to showing you the shape of the curve underneath that number, which is where the actual story lives.
Reading that shape correctly is less about a better tool and more about knowing what pattern to expect before you look for it.
What actually happens when you scale ad spend
The book in this kit, Mastering Paid Marketing Metrics, walks through a real scaling scenario for an e-commerce company that increased its monthly ad spend from $10,000 to $50,000, and the numbers are worth sitting with. At $10,000 a month, the campaign ran at a 6:1 return on ad spend, generating $60,000 in revenue with a $40 customer acquisition cost, a 3.2% conversion rate, and a $1.28 cost per click. At $50,000 a month, revenue rose to $150,000, a 150% increase, but the return on ad spend fell to 3:1, acquisition cost rose to $70, conversion rate dropped to 2.1%, and cost per click nearly doubled to $2.15.
Total revenue went up. Efficiency went down. Both of those are true at once, and the book's point is that most reporting only shows you the first one.
The book frames this as three predictable phases every scaling campaign passes through. Exponential growth comes first, when ads reach the audience that was already actively looking for the solution, the "low-hanging fruit" that makes the early numbers look almost too good. Linear growth follows, where each additional dollar still brings new customers, but at a steadily rising cost, because you're now competing harder in an auction-based system for the same placements. Diminishing returns comes last, when the profitable audience is largely exhausted and each new dollar goes toward reaching people who were never that likely to convert in the first place.
None of this is an argument against scaling. It's an argument for recalculating your acceptable acquisition cost before you do it, using your actual margins rather than the number that felt fine at the smaller budget. A business with 70% margins can absorb a rising CAC that would sink a business running on 3%.
Where people go wrong
The most common mistake is watching click-through rate and calling it a success metric on its own. The book's own example: a fitness equipment ad promoting "Professional Home Gym Equipment" pulled a 5% click-through rate, well above average, and a 0.5% conversion rate, because visitors' idea of "professional" didn't match what the landing page delivered. A high click-through rate paired with a weak conversion rate isn't good news with an asterisk. It's usually a mismatch between the ad's promise and the page behind it.
The second mistake is relying on last-click attribution and drawing conclusions from it. The book cites a B2B software company that nearly cut its LinkedIn ad spend because last-click reporting showed it converting poorly, until a proper attribution review revealed LinkedIn had actually started 45% of the company's successful customer journeys, just without getting credit for starting them.
The third is scaling budget by a fixed percentage across every channel instead of watching where the return curve actually bends first. A channel that's still in its exponential phase can absorb a much bigger increase than one already sliding into diminishing returns, and a flat across-the-board increase treats both the same way.
A fourth, related mistake is reacting to a falling ROAS by cutting the budget straight back to where it was, instead of asking whether the new, lower number is still profitable given your actual margins. A 3:1 return that felt disappointing next to a 6:1 return might still be well worth running. Applying the three-phase pattern above to a specific channel mix, not just to total spend, is the kind of cross-channel thinking covered in the paid ads and landing pages guide.
Inside Mastering Paid Marketing Metrics
Going deeper
- AudioFrom Clicks to Cashflow
- BookMastering Paid Marketing Metrics
- ChecklistPerformance Tracking Infrastructure
- ChecklistROI-Focused Advertising Optimization
- GuideBenchmarking for Better Ads
- GuideROAS that Actually Pays
- Mini-CourseMeasure What Matters Most
- Prompt PackPaid Advertising Optimization
Mastering Paid Marketing Metrics is one of 13 bundles in The Paid Ads & Landing Pages Pack, or take the whole pack for $29.
Related reading

Paid ads and landing pages: the complete guide for small budgets
How to run paid ads on a small budget: pick one platform, write the ad, fix the landing page, and read the numbers before you spend more.
Read more
YouTube ads: what happens in the first three seconds
Viewers decide whether to skip a YouTube ad within two to three seconds, so the opening shot carries most of the weight.
Read more
A/B testing for ads: deciding what to test first
A scoring method for ranking which ad element to test first, so testing time goes to headlines and targeting instead of button colors.
Read more