
Four email metrics worth checking weekly
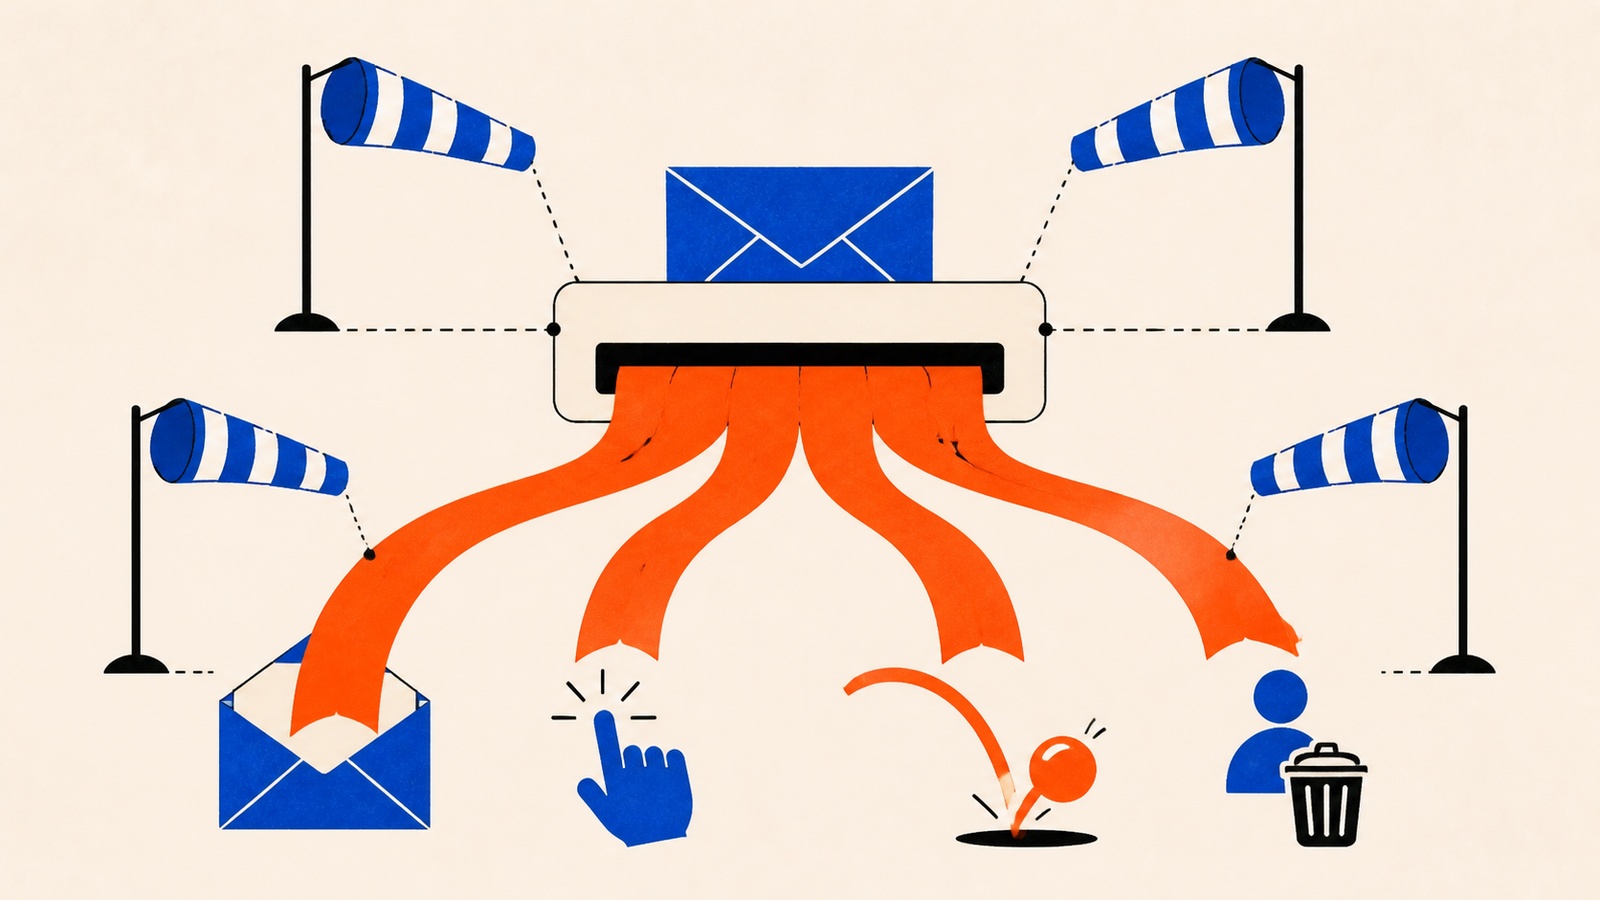
Most people checking their email dashboard are looking at one number, open rate, and treating it as a verdict on the whole campaign. It isn't. A subject line can pull people in and still lose them a sentence later, and a dashboard that only shows opens has no way of telling you that happened, so the same campaign gets called a success or a failure depending on which single number happened to be visible first.
The four foundational metrics work as a set, not individually, and reading them together is what actually tells you where a campaign is breaking down. Open rate without click-through tells you the subject line worked and nothing else. Click-through without a look at unsubscribes can hide the fact that you're burning the list to get there, trading short-term clicks for subscribers who won't be around for the next send.
This isn't a call to track more numbers. Most email platforms already report all four by default: the gap is in reading them together instead of glancing at whichever one is displayed first on the dashboard.
The four formulas, and what one retailer did with them
Email Marketing Metrics opens with the four numbers most email platforms report by default, and the formulas behind them:
- Open rate = (unique opens ÷ delivered emails) × 100
- Click-through rate = (unique clicks ÷ delivered emails) × 100
- Bounce rate = (bounced emails ÷ sent emails) × 100
- Unsubscribe rate = (unsubscribes ÷ delivered emails) × 100
Reading them as a set: a high open rate paired with a low click-through means the subject line is doing its job but the email itself isn't. A low open rate with strong clicks among the people who did open means the opposite: the content works, but not enough people are seeing it in the first place. That distinction changes what you fix, and it's invisible if you're only tracking one number.
The book's worked example is an outdoor gear retailer starting from a fairly typical baseline for the category: a 15% open rate, 1.5% click-through, and a 0.3% unsubscribe rate, numbers that wouldn't have raised any alarms on their own but left plenty of room to improve. They segmented their list by purchase history and browsing behavior, rewrote subject lines to be specific to each segment, redesigned the templates around a single visible call to action, and added a preference center so subscribers could set their own frequency. Nothing on that list is exotic: it's the standard segmentation and CTA advice most guides give.
What changed is the number, tracked over three months:
| Metric | Before | After |
|---|---|---|
| Open rate | 15% | 28% |
| Click-through rate | 1.5% | 3.7% |
| Unsubscribe rate | 0.3% | 0.08% |
Open rate nearly doubled, click-through more than doubled, and unsubscribes fell to roughly a quarter of the starting figure: all three moving in the same direction from the same set of changes, which is the point of tracking them together rather than picking one to optimize.
None of the individual changes here would look remarkable in isolation. Segmenting a list, tightening subject lines, and adding one visible CTA are all standard advice on their own. What the case study actually demonstrates is that the formulas are what let you confirm the changes worked, rather than assuming they did because the emails felt better to send.
Where people go wrong
The most common mistake is comparing a number to a memory instead of a formula. "Our open rate feels low" isn't a metric, it's a guess, and it's usually wrong in one direction or the other because nobody actually ran the calculation against delivered emails rather than sent emails: a small but consistent error that skews every number built on top of it.
The second is optimizing a single metric in isolation. Chasing a higher open rate with more aggressive subject lines while ignoring a climbing unsubscribe rate is a short-term win that costs list quality: the retailer's case above only worked because all three numbers were watched at once, not because any single change happened to help.
The third is running an A/B test on a list too small to produce a real answer, then acting on the result as if it were meaningful. A test on a few hundred subscribers, run once, shows you noise more often than it shows you a genuine winner, and treating that noise as a lesson learned means the next campaign gets built on a conclusion that never actually held. What counts as a large-enough sample, and how the split-testing discipline actually works, is covered in the Email & SMS guide.
Inside Email Marketing Metrics Ebook
Going deeper
- BookEmail Marketing Metrics - Ebook
- ChecklistEmail Marketing Metrics - Checklist
- GuideEmail Marketing Metrics - Guide
- Prompt PackEmail Marketing Metrics - Prompts
- ToolstackEmail Marketing Metrics - Toolstack
- WorkbookEmail Marketing Metrics - Workbook
Email Marketing Metrics Ebook is one of 6 bundles in The Email & SMS Pack, or take the whole pack for $29.
Related reading
Email and SMS marketing for a small list: the complete guide
How email and SMS work for a small list: permission, segmentation, sequence, channel choice, and the numbers actually worth tracking.
Read moreMatching email strategy to the customer lifecycle
A stage-by-stage table for aligning email content with where a subscriber actually is, plus a formula for winning back dormant ones.
Read more
Nurture emails written for one specific reader
A persona-building method for nurture emails, matched to the four stages a subscriber actually moves through before buying.
Read more